Soil maps of Emilia-Romagna
Soil map and thematic maps of soil properties
The regional soil mapping project is aimed at creating an inventory of the "soil resource." It is primarily descriptive in nature: characteristics of different types of soils, their description, how they were formed, and how they interact with other environmental components (climate, vegetation, rock substrate, geomorphological dynamics, human interventions). The project, launched in 1975-1980 to support land-use planning activities, it has produced information available throughout the territory at different scales of detail, from 10,000 to 250,000.
Over the years, data acquisition methods have been defined, with the drafting of a Soil Survey Manual (ed. 2020), the definition of a Soil Information System and the definition and description of Soil Typological Units (STU Catalogue) and Mapping Units (SMU Catalogue) present in the regional territory.
In this website it is possible to consult and query the Soil Map and the thematic maps derived and defined from it according to an integrated approach.
Go to the WebGis
(in Italian Language)

Themes
Soil map at 1:50.000 scale and the benchmark local sites
The soil map covers 78% of the regional territory (entire plain area, 93% of the lower Apennines -hills- and 37% of the middle Apennines). Each individual polygon (delineation) of the soils map is described for its constituent soils. For each soil in each polygon, a representative local site is associated, of which chemical and physical analyses can be consulted and downloaded. Polygons with similar distribution of soils constitute a Mapping Unit. Using the appropriate query button it is possible to consult each delineation, view the description of the mapping unit and the soils present, and also the description of the representative profile of each soil. The map is the 2021 edition; previous editions date back to 1992, 1998, 2005, 2012, 2014, 2015 and 2018. It is the result of surveys carried out from 1980 to 2021 and subsequent correlations, the last of which was completed in 2021.
Extension Service soil analyses
40.000 routine chemical-physical analyses (sand, silt, clay, pH, total carbonate, active carbonate, organic matter, exchangeable K, available P, total N) of soil samples (mostly on superficial horizons-topsoil). Their use is for extension service in Agriculture and to improve the description of the soil polygons.
Heavy metal data inventory
Soiil samples (heavy metals content with aqua regia method) at a depth of 20-30 cm. This data were used with a geo-statistical approach to produce background maps of 9 heavy metals.
Shallow Water Table Measurement Sites
Measurement sites of the shallow water table (0-3 m) in the alluvial plain of the Emilia-Romagna region.
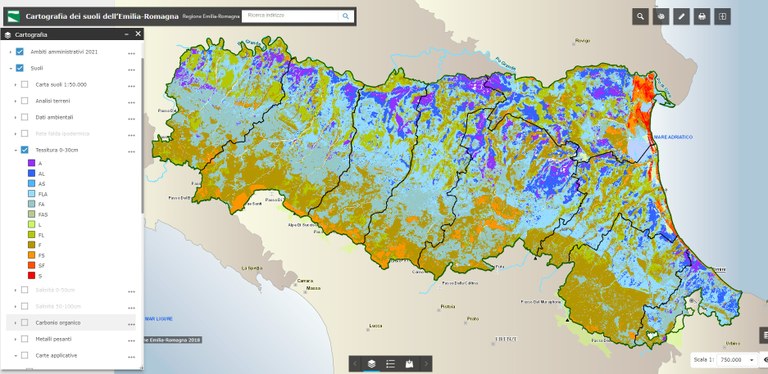
Soil texture map 0-30 cm
The regional soil texture map is the result of statistical and geostatistical processing that, from granulometric analyses, takes into account the distribution of soils across the landscape. The map is represented through a raster with 100m x 100m pixels. Each pixel is assigned a % value of sand, silt, clay, skeleton, and USDA texture class. Each parameter is accompanied by a reliability assessment of the estimated value.
pH map 0-30 cm
The regional soil pH map is the result of statistical and geostatistical processing that, from point values of pH, takes into account the distribution of soils across the landscape. The map is represented through a raster with 100m x 100m pixels. The pH value is accompanied by an assessment of the reliability of the estimated value.
Soil salinity maps
The map is available for both the 0-50 cm layer (updated 2015) and the 50-100 cm layer (2010). It was compiled from point data through geostatistical analysis and is considered a second/first approximation in anticipation of greater data availability to improve the quality and reliability of the estimated values. The parameter is expressed as saturated paste electrical conductivity (dS/m).
Macronutrients (N, P, K) map 0-30 cm
The regional maps of Total N, exchangeable K and available P are the result of statistical and geostatistical processing that, from N, P, K analyses, takes into account the distribution of soils across the landscape. The map is represented through a raster with 100m x 100m pixels. Each parameter is accompanied by a reliability assessment of the estimated value.
Soil organic carbon content maps (%)
Maps of the the organic carbon content (%) of soils are the result of statistical and geostatistical processing that, from point values of organic carbon, take into account the distribution of soils across the landscape and the influence of agronomic management on organic matter accumulation. They are available for the 0-30 cm layer over the entire region (raster with 100m x 100m pixels) and for the 0-100 cm layer (vector with 500mx500m squares in the plain and 1kmx1km squares in the Apennines).
Soil organic carbon stock maps (Mg/ha)
These maps estimate the stock of organic carbon in soils (expressed in Mg/ha) considering the distribution of different soil types and the incidence of non-soil areas, understood as areas occupied by surface water, urban and infrastructure. The distinction between areas occupied by soil and those occupied by nonsoil is derived from the Land Use Map 2017. They are available for the 0-30 cm layer over the entire region (raster with 100m x 100m pixels) and for the 0-100 cm layer (vector with 500mx500m squares in the plains and 1kmx1km squares in the Apennines).
Pedo-geochemical of heavy metals maps
The maps represent the natural pedogeochemical content according to ISO/DIS 19258, 2005 of six potentially toxic metals-Chromium [Cr], Copper [Cu], Nickel [Ni], Lead [Pb], Vanadium [V] and Zinc [Zn]-in the subsoil of agricoltural soils (90-140 cm depth, 60-80 cm for gravelly soils). This depth is considered representative because it is not affected by anthropogenic contributions. The maps are only available for the alluvial plain area and are validated for a recognition scale (1:250,000).
Background content of heavy metals maps
The maps represent the areal distribution in the topsoil (20-30 cm depth) of nine potentially toxic metals - Chromium [Cr], Cadmium [Cd], Nickel [Ni], Zinc [Zn], Copper [Cu], Lead [Pb] Tin [Sn], Arsenic [As] and Vanadium [V] - in agricoltural soils: this depth is considered representative of the natural- anthropogenic background content (background content according to ISO/DIS 19258, 2005). The maps are only available for the alluvial plain area and are validated for a recognition scale (1:250,000).
Land Capabilty map
The map is an assessment of the production capacity of soils over long periods of time without the occurrence of degradation. Through the SINA 2000 assessment scheme, which takes in account specific soil and environmental qualities, it was possible to assign each delineation, based on the percentages of soils present, a certain class of land capability while also specifying its limitations. The classification system has eight classes defined according to the type and intensity of soil limitation conditioning both the choice of crops and their productivity. Assignment to the class is made on the basis of the most limiting factor; in the next step soils are assigned to subclasses and units of land capability.
Soil Ecosystem services maps
There are eight maps related to soil functions underlying ecosystem services : buffering capacity (BUF); carbon-sequestration (CST); erosion control (ERSPRO); food provision (PRO); biomass provision (BIOMASS); water regulation (WAR), water storage (WAS), and habitat for soil organisms (BIO). They can be consulted through a map of a 5-class synthetic quality index that sums up the four most established ecosystem services (PRO, CST, WAR, BUF).
Soil permeability (Ksat) map
The map describes the areal distribution of the Ksat classes of soils according to the Soil Survey Manual, 1993 scheme through the polygons of the 1:50,000 scale Soil Map. For each polygon, the weighted average Ksat value was calculated based on the percentage of spread of soils in it. This value was then ranked for the purpose of representation.
Hydrologic Soil Group map
The map describes the areal distribution of the Hydrologic Groups of the soils of the alluvial palin through the polygons of the Soil Map at a scale of 1:50,000. Each polygon is described by the percentage of spread of the Hydrological Groups in it. The Hydrologic Groups indicate the potential behavior of soils in generating surface water runoff, according to the USDA-NRCS methodology (2009 version). The latter is based on the assumption that soils within the same climatic region, similar in depth, infiltration capacity, texture, structure and water table depth, have the same response to surface run-off.
