Landslide characteristics in Emilia-Romagna
Introduction
In the field of morphological evolution of slopes, landslides constitute the most apparent manifestation of mass transport, with the most severe repercussions on human activity. To gain a better understanding of their importance in the evolution of slopes, we can observe the very high number of landslides which occur each year in the region, especially in the wet seasons (autumn and spring), frequently affecting roads and sometimes buildings. While it might appear that these landslides occur largely in areas previously unaffected by such phenomena, in actual fact the majority of landslide bodies, and large ones in particular (> 1 Ha), reveal characteristics of significant persistence over time and their present-day distribution is the result of the gradual evolution of slopes over thousands of years: this evolution is characterised by alternating periods of dormancy, lasting many years or even centuries, and periods of renewed mass mobilisation, of variable amplitude, coinciding with exceptional climatic events (and perhaps with strong earthquakes). Indeed, radiocarbon dating carried out by the Emilia-Romagna Regional Authority (Bertolini et al., 2005) and the University of Parma (Tellini, 2004) on plant remnants trapped inside landslide bodies, demonstrates that many landslide bodies are most probably the result of long sequences of events that began at the end of the last glacial age (the oldest datings go back to approximately 13,500 years ago).
Almost all currently active landslides are therefore either total or partial recurrent reactivations of existing landslides, affecting new surfaces and bringing bodies overlap. New landslides, or the mobilisation of areas previously not involved in any mass movements, are extremely rare and generally small, as can be seen from comparative analysis of aerial and satellite images available for the past 60 years, and from historical data on villages and recorded landslides, available with variable frequency from the end of the medieval age.
Two important implications, in terms of territorial knowledge and management, result from the particular nature of landslides in the Emilia-Romagna Apennines:
- Areal stability of landslide bodies enables reliable landslide mapping over time, which is therefore useful for planning purposes;
- The intermittent activity of landslides bodies, especially the larger ones, characterised by slow movement alternating with long periods of quiescence, may cause the population to underestimate the danger of sites, which are mostly gently sloping, often farmed and "attractive" for urban expansion. It is also possible to lose historical memory of landslides activity characterised by very long return period (more than a generation).
For these reasons, the Geological, Seismic and Soil Survey, in addition to detailed landslide mapping, promoted, and is now updating, a database of documentary informations on the landslides reactivations in former times, in order to preserve the historical memory of such events and their consequences on the life of local communities.
General information
 The landslides database, developed over a number of years by the Geological, Seismic and Soil Survey as part of various projects and activities (IFFI Project – Italian Landslides Inventory, Geological Cartography Project 1:10000, provincial working groups, etc.) and subject to constant updating, provides information on the nature and state of activity of landslides, on a 1:10000 scale, for the entire hill and mountains area of Emilia-Romagna, together with a lot of data derived from studies, drillings and reports.
Evidence today indicates that Emilia-Romagna is one of the three regions in Italy with the higher percentage of landslides: data from the national IFFI project indicates that together with Lombardy and Marches, our Region is characterised by over 20% of the hill and mountain territory affected by active or dormant landslides.
Below are some data (revised in 2006) taken from the internal report “statistical elaboration on landslides in Emilia Romagna” relative to the distribution of landslides in the region.
Table 1 : Statistical data on regional landslides
| Total regional area | 19.489,1 Km2 |
| Hill and mountain area | 10.541,5 Km2 |
| Plain area | 8.947,7 Km2 |
| Total area affected by landslides | 2.510,7 Km2 |
| Active landslide area | 699,5 Km2 |
| Dormant landslide areae | 1.810,9 Km2 |
| Stabilized landslide area | 0,28 Km2 |
| Landslides Total number | 70.037 |
| Active landslides Number | 38178 |
| Dormant and Stabilized landslides Number | 31859 |
| Average landslide dimensions | 3,55 ha |
| Regional landslide index (total) | 12.88 % |
| Regional landslide index (hill and mountain area) | 23.82 % |
| Active landslides average dimensions | 1,83 ha |
| Dormant landslides average dimensions | 5,63 ha |
The following table presents landslide data for Provincial administrative areas, with the exception of the Ferrara Province. Data are derived from the geological database 1:10000 (last updated in November 2005 - completed IFFI project data).
Table 2 - Summary table of provincial areas, divided into mountain and plain areas, and relative landslide indices (L.I.), calculated on the state of landslide activity
| PROVINCE | PC | PR | RE | MO | BO | RA | FC | RN | |
|---|---|---|---|---|---|---|---|---|---|
| AREA OF PROVINCE (Km2) |
TOTAL | 2587.6 | 3447.0 | 2290.3 | 2688.8 | 3702.2 | 1859.7 | 2385.6 | 528.0 |
| MOUNTAIN | 1544.7 | 2271.1 | 1125.7 | 1301.2 | 1835.2 | 339.0 | 1830.7 | 293.9 | |
| PLAIN | 1042.9 | 1176.0 | 1164.6 | 1387.6 | 1867.0 | 1520.7 | 554.9 | 234.1 | |
| AREA AFFECTED BY LANDSLIDES (Km2) |
ACTIVE | 83.8 | 168.6 | 117.3 | 65.3 | 123.8 | 13.9 | 117.0 | 9.9 |
| DORMANT | 354.6 | 508.1 | 178.3 | 236.4 | 269.4 | 29.4 | 200.8 | 33.9 | |
| STABILIZED | 0.0 | 0.0 | 0.0 | 0.0 | 0.2 | 0.0 | 0.1 | 0.0 | |
| TOTAL | 438.4 | 676.6 | 295.6 | 301.7 | 393.4 | 43.3 | 317.9 | 43.9 | |
| LANDSLIDE INDEX MOUNTAIN AREA (%) |
L.I. ACTIVE LANDSLIDE | 5.42 | 7.42 | 10.42 | 5.02 | 6.75 | 4.10 | 6.39 | 3.37 |
| L.I. DORMANT LANDSLIDE | 22.96 | 22.37 | 15.84 | 18.17 | 14.68 | 8.67 | 10.97 | 11.55 | |
| L.I. STABILIZED LANDSLIDE | 0.00 | 0.00 | 0.00 | 0.00 | 0.01 | 0.00 | 0.00 | 0.00 | |
| TOTAL L.I. | 28.38 | 29.79 | 26.25 | 23.18 | 21.44 | 12.77 | 17.36 | 14.92 | |
| LANDSLIDE INDEX ENTIRE PROVINCE (%) |
L.I. ACTIVE LANDSLIDE | 3.24 | 4.89 | 5.12 | 2.43 | 3.35 | 0.75 | 4.90 | 1.88 |
| L.I. DORMANT LANDSLIDE | 13.70 | 14.74 | 7.78 | 8.79 | 7.28 | 1.58 | 8.42 | 6.43 | |
| L.I. STABILIZED LANDSLIDE | 0.00 | 0.00 | 0.00 | 0.00<</td/> | 0.01 | 0.00 | 0.00 | 0.00 | |
| TOTAL L.I. | 16.94 | 19.63 | 12.90 | 11.22 | 10.63 | 2.33 | 13.33 | 8.31 |
There are two possible, and probably concomitant explanations for the greater dimensions of dormant landslides compared to others: the first is that a great number of dormant landslides consist of an overlapping over time and space of activations/reactivations with relative retrogressions, advancements, widening and coalescence of various bodies. The cartography of the resulting deposits, if dormant, is frequently unable to distinguish the shape of each individual phenomenon, often obliterated by vegetation or agricultural practices, which can actually hide all traces of smaller, more superficial landslides. On the contrary, cartography of active landslides describes the distribution and shape of individual episodes or, at most, of a number of phenomena recorded over a short period of time. This allows detailed mapping of small and very small landslides, often partial reactivations of dormant landslides.
The second possible explanation is that likelihood of landslide reactivation is inversely proportional to the size of the bodies. The relatively small number of big dimensioned landslides reactivations (considering the total number of reactivations) over the last 60 years, confirm this hypothesis.
Landslide Types
 Fig. 2 - Percentage of landslides by type of movement
Attribution of landslide type (classes by Cruden and Varnes,1996) was made during data processing, and not during survey. Considering the high number of landslides, an entirely GIS-based method has been adopted, with observation and interpretation of aerial and satellite photos together with calculation of morphometric parameters (area, perimeter, area/perimeter ratio, n. of crowns of each single landslides, average width, length, average bodies slope angle, longitudinal and transversal convexity/concavity) and dominant lithology. The result, illustrated in Figure 2, must be considered as purely indicative, since the type of movement can change for different reactivations even on the same landslide body.

Fig. 3 - Some examples of landslide types in Emilia-Romagna: a: Slow earth flow in Solignano village (PR); b: Complex landslide in Corniglia village (PR); c: Roto-translational slide in Civitella village (FC); d: Rockfall in Monzuno village (BO.) |
Some general considerations can be made regarding landslides type in Emilia-Romagna: slides are the most frequent type of movement, since the lithological and lithotechnical characteristics of the Apennines, dominated by turbidite deposits, made up of alternations of massive rocks (mostly sandstones and calcarenites) and pelites or marly pelites. Slides most frequently occur in the middle – upper Apennines and in Romagna. Slow earth flows are the second most common type of landslide and prevalently occur on argillaceous lithologies (Ligurian and Subligurian units), outcropping in the middle-lower Emilia Apennines, and in the lower Romagna hill area (neogene-quaternary sequence of the Po plain margin). Complex landslides are particularly frequent in the middle Apennines, on Ligurian Flysch units, characterized by several large, deep landslides on frequently fractured arenitic-pelitic sequences, on which landslides consist generally of rotational slide (crown area) and slow earth flow. Rockfalls are not particularly frequent, since vertical surfaces and massive rocks are generally rare.
Lithotechnical map

Fig. 4 - Lithotechnical map - enlarge image (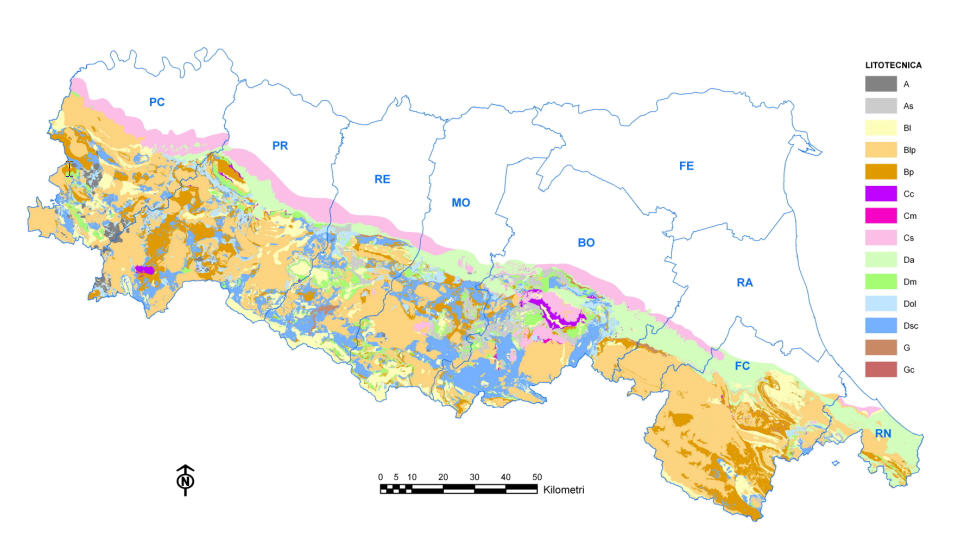 85.4 KB)
A: massive rocks; As: stratified massive rocks; Bl: massive /pelitic alternations with L/P>3; Blp: massive /pelitic alternations with 0.3<L/P<3; Bp: massive /pelitic alternations with L/P< 0.3; Cc: clast-supported conglomerates ; Cm: matrix-supported conglomerates; Cs: weakly cemented sands; Da: consolidated clays; Dm: Marls; Dol: olistostromic clays; Dsc: Tectonized clays and argillites; G: Gypsums; Gc: Gypsums in chaotic deposits..
 Fig. 5 - Map of Geological-Structural Domains - enlarge image (
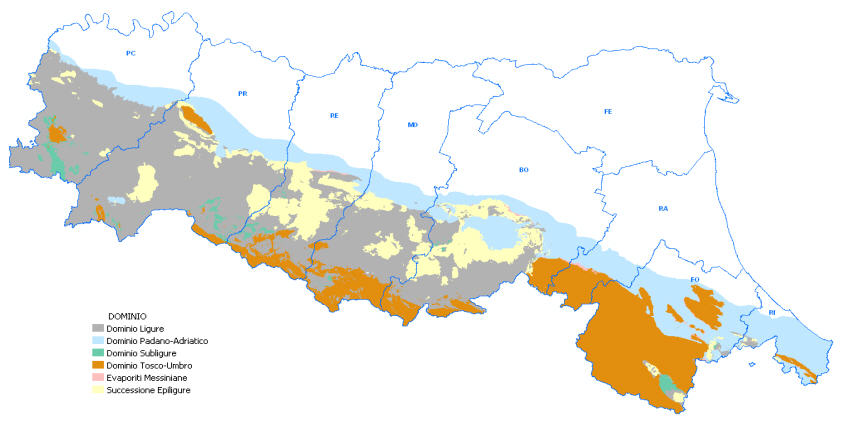 56.83 KB)
The territorial distribution of landslides reveals their close dependency on mainly argillaceous or structurally complex formations .

Fig. 6 - Landslide Index for lithotechnical class Blp - Alternation with 1/3 < massive rock/ pelitic rock < 3 in the different regional structural domains - enlarge image ( 3.65 MB)
Lithotechnical class being equal, different structural domains are characterized by different landslide indices. Calculating the L.I. for main apenninic structural domains (Fig.5) we can observe significant differences, only in part due to the different lithologies; this is due also to the different historical stress paths of rocks. Figure 13 illustrates an example of differing L.I. between different domains, with the same lithotechnical class. L.I. are directly proportional to the stress suffered and inversely proportional to the lithostatic load.
Landslides and Land use
 Figure 7 - Number of landslides per Land Use category I enlarge image (
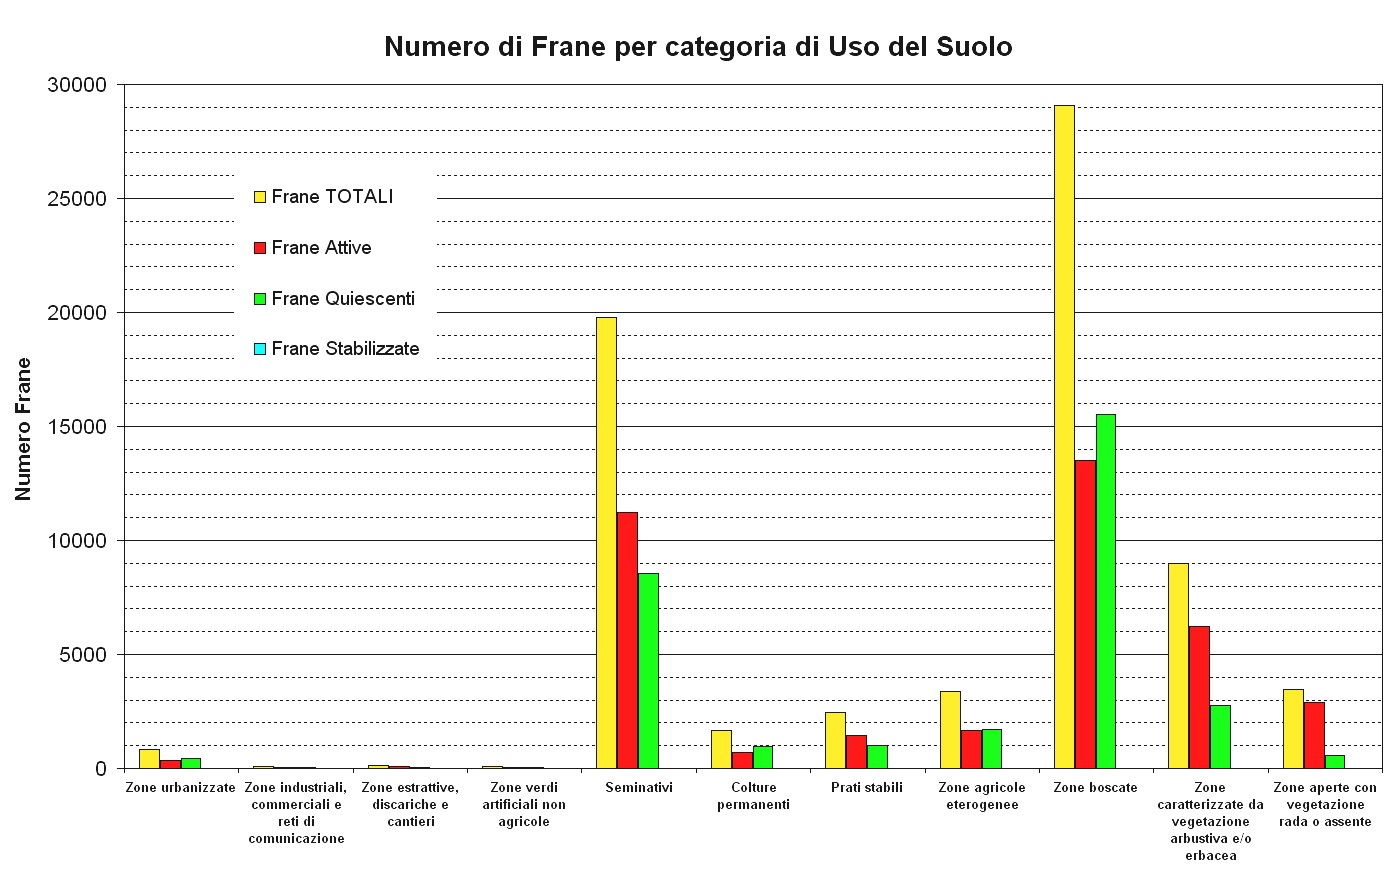 255.66 KB)
Other analyses have focused on the relationship between landslide distribution and land use. We used the regional land use cartography as surveyed in 2003, with the 15 classes of the Corine Land Cover project (CLC) at level 2, thus guaranteeing uniformity at national level.
Figure 14 represents the distribution of the number of landslides per classes of land use in the Apennines. It is worth noting that some land use classes are of little significance, and that the 1:25000 land use scale is not the same used in the Landslide Inventory.
, per Land Use category")
Fig. 8 - Landslide index (for regional hill and mountain area only), per Land Use category I enlarge image (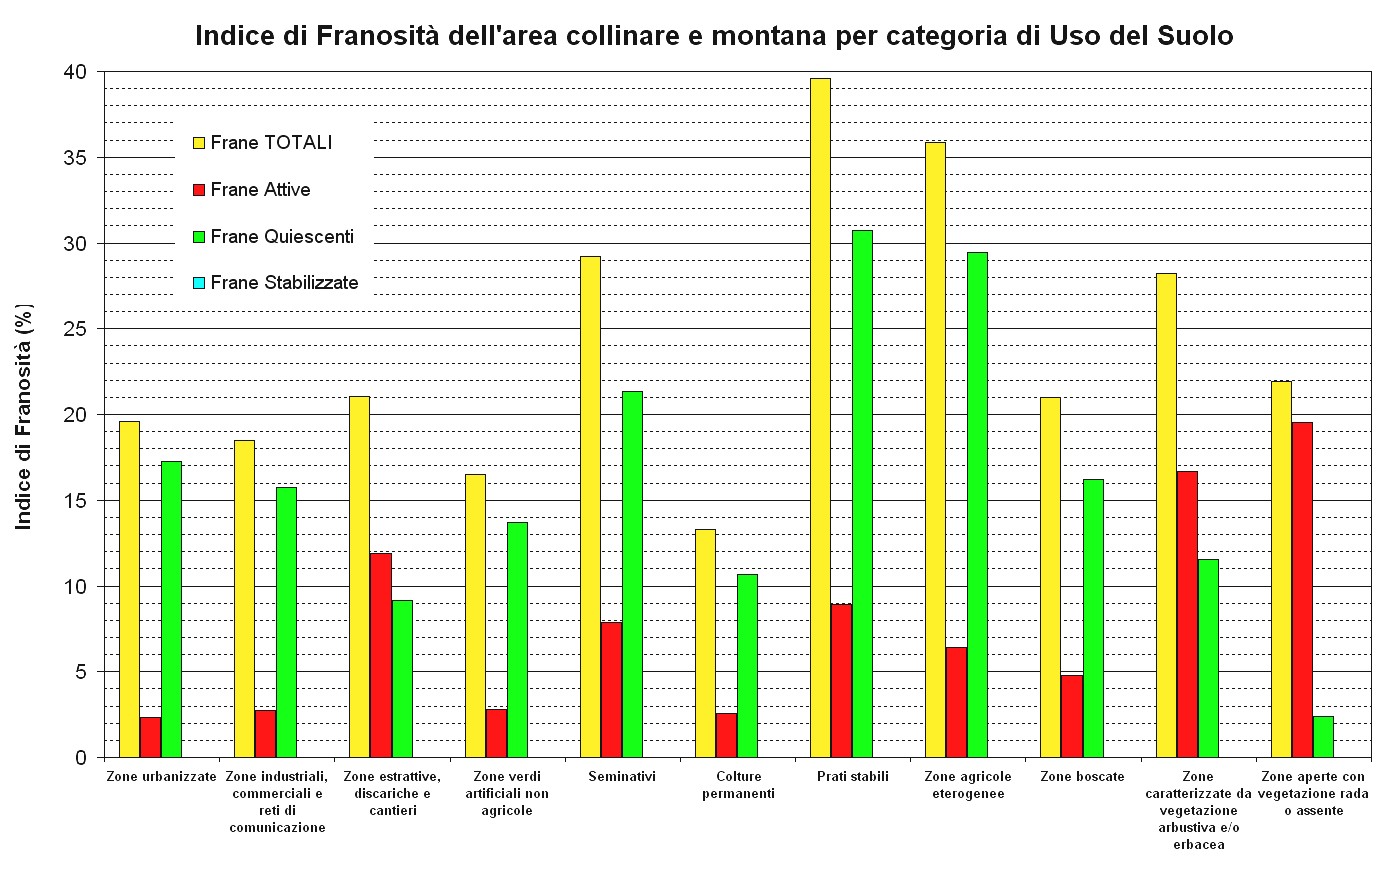 329.4 KB)
The L.I. per land use classes are shown in figure 15, though interpreting the results of the analysis is a complex task. The highest landslide index is that of “Permanent pastures”, although they have little bearing on the total area, while arable cropland, shrub land and heterogeneous agricultural areas are more affected by landslides than wooded areas. Likewise, it is not possible to construe on the basis of this initial approximation whether landslides can be attributed to land use or whether both landslides and land use both depend on other common factors, such as lithology (for example, both arable crops and landslides are more widespread on argillaceous lithologies, while woodland is more widespread on arenaceous lithologies, which are on the whole less susceptible to landslides). We can obtain more accurate information by dividing the control group of landslides according to level of activity: it is interesting to note that, while for almost all categories dormant landslides occupy areas from 2.7 to 7.4 times greater than active landslides, for three categories: “Areas characterised by shrubs and/or herbaceous vegetation”, “Open areas with sparse or no vegetation” and “Mineral extraction areas, dumps and construction sites”, the ratio is the opposite, with a prevalence of active landslides between 1.3 and 8.2 times the area of dormant ones, highlighting how the landslides state of activity for this categories appears to be influenced by a degraded use.